Factry’s mission is to make it ever easier to learn from industrial data. As part of this commitment, we have signed an agreement with Grafana to publish the Factry Historian data source plugin for Grafana in their catalog. This datasource plugin brings all benefits of Factry Historian to Grafana, making the end-user experience much more fluent. The plugin is designed to transform how you interact with and visualize your industrial process data, making it more accessible than ever before.
In this blog post, we’ll explain why we built it, and highlight some of its features with a use case. Read on!
Why Did We Build It?
Industrial Control Systems and other sensors are generating more data than ever before. Organizations increasingly realize that this data needs to be turned into useful information so that decisions can be made (by man or machine) to improve processes. Although “turning data into information” has been done for decades, new technologies make it ever easier for non-technical people to share in the spoils. As a result, organizations can collectively ditch the opinions-based decision making process and switch more towards data-driven decisions.
According to a Deloitte report from 2019, the concept of the “augmented engineer” is becoming increasingly prevalent. This trend highlights the need for tools that enable engineers to make data-driven decisions without requiring them to become experts in complex data management systems.
Trending time-series data with Grafana is pretty straightforward, but there have been significant gaps in the ease of use for non-experts, especially if those users had prior experience with classic industrial historians. Users especially have missed features such as auto-loading Units of Measurement (UoM), scaling, auto High/Low limits (HI/LO), and displaying of events frames. The Factry Historian data source plugin brings these features to Grafana.
What Can You Do with the Grafana Data Source Plugin?
The plugin brings various features designed to enhance the experience with industrial data visualization. Here are some of the most important capabilities:
- Asset structure: Browse for data and events using your asset structure e.g. ISA95 equipment model.
- Auto UoM Loading: Automatically load Units of Measurement, saving time and reducing errors. 37 what? 37 °C!
- Scaling and Auto HI/LO: Automatically set y-axis scaling and high/low limits, making trends easier to interpret.
- Event Overlaying: Easily overlay events on top of each other, or overlay events over time-series data.
- Dashboard Variables: Make your dashboards templatable by configuring variables for Assets, Asset Properties, Events and more.
For a detailed feature list, please visit our GitHub repository.
The Grafana Data Source Plugin connects to the Factry Historian REST API. Factry Historian and our API address the typical shortcomings of open source TSDBs, providing a robust solution for industrial data management.
Example Use Case: a Malting Company
To illustrate the power of our plugin, let’s look at how a malting company, could benefit from Factry Historian’s data source plugin for Grafana:
Setup in Factry Historian
First, we set up our Collectors and Measurements, making sure we have the required data needed for this demonstration. This is not in the scope of this blog.
Next, we’re building our asset structure. Suppose we have a Belgian site, with a Germination, Kilning and Steeping area. For this demo, we’re going to configure 2 steeping tanks.
On each Steeping Tank, we configure a couple of example properties. In this case, I configured a Temperature and Volume property on the tank.
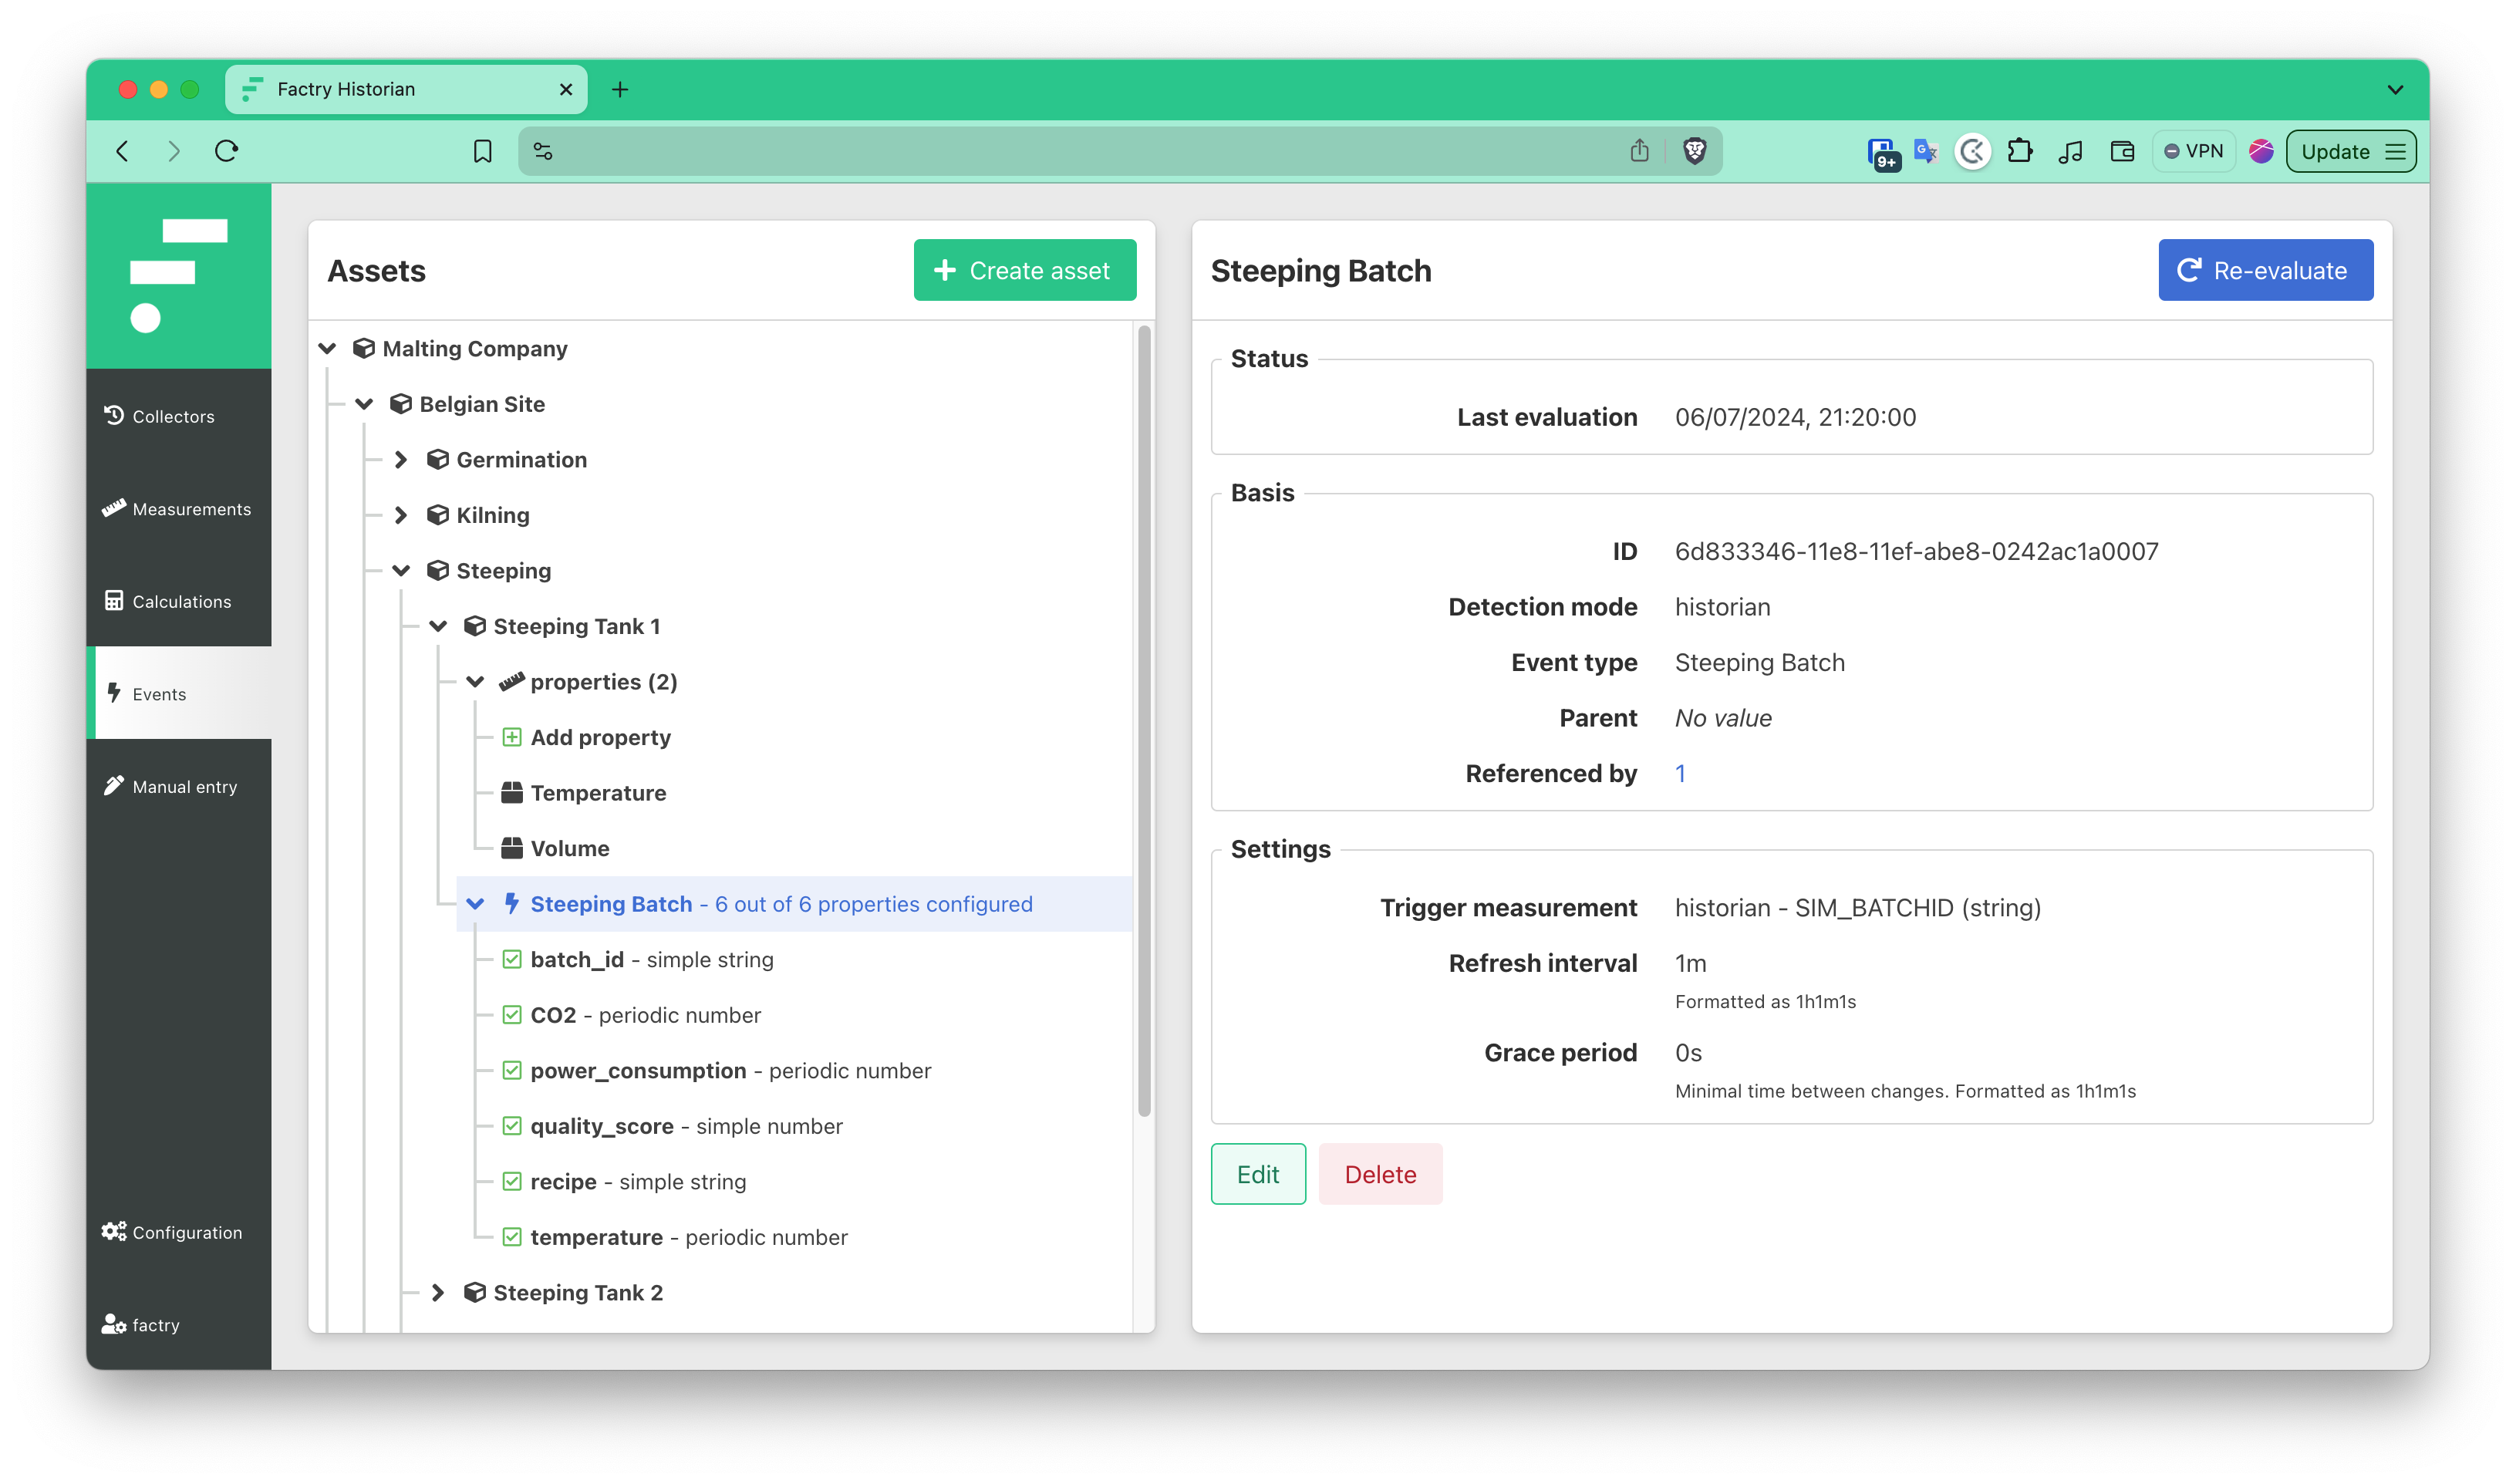
Next, we’re configuring a “Steeping Batch” event to Steeping Tank 1. For each Steeping Batch, we’d like to know the following properties: - A Batch ID: a string value - CO2 concentration: we will be sampling the CO2 concentration over the course of the batch - Power consumption: we will be sampling the power consumption over the course of the batch - Quality score: this will be a manual property, to be completed by the QC responsible after the batch has completed. - Recipe: a simple string value - Temperature: just like with CO2, we will be sampling the temperature over the course of the batch
Finally, we’re configuring a Manual Entry Form. Most of our data comes from our SCADA system, so we display those values in the form. Only the Quality Score needs to be completed. All other values are editable.
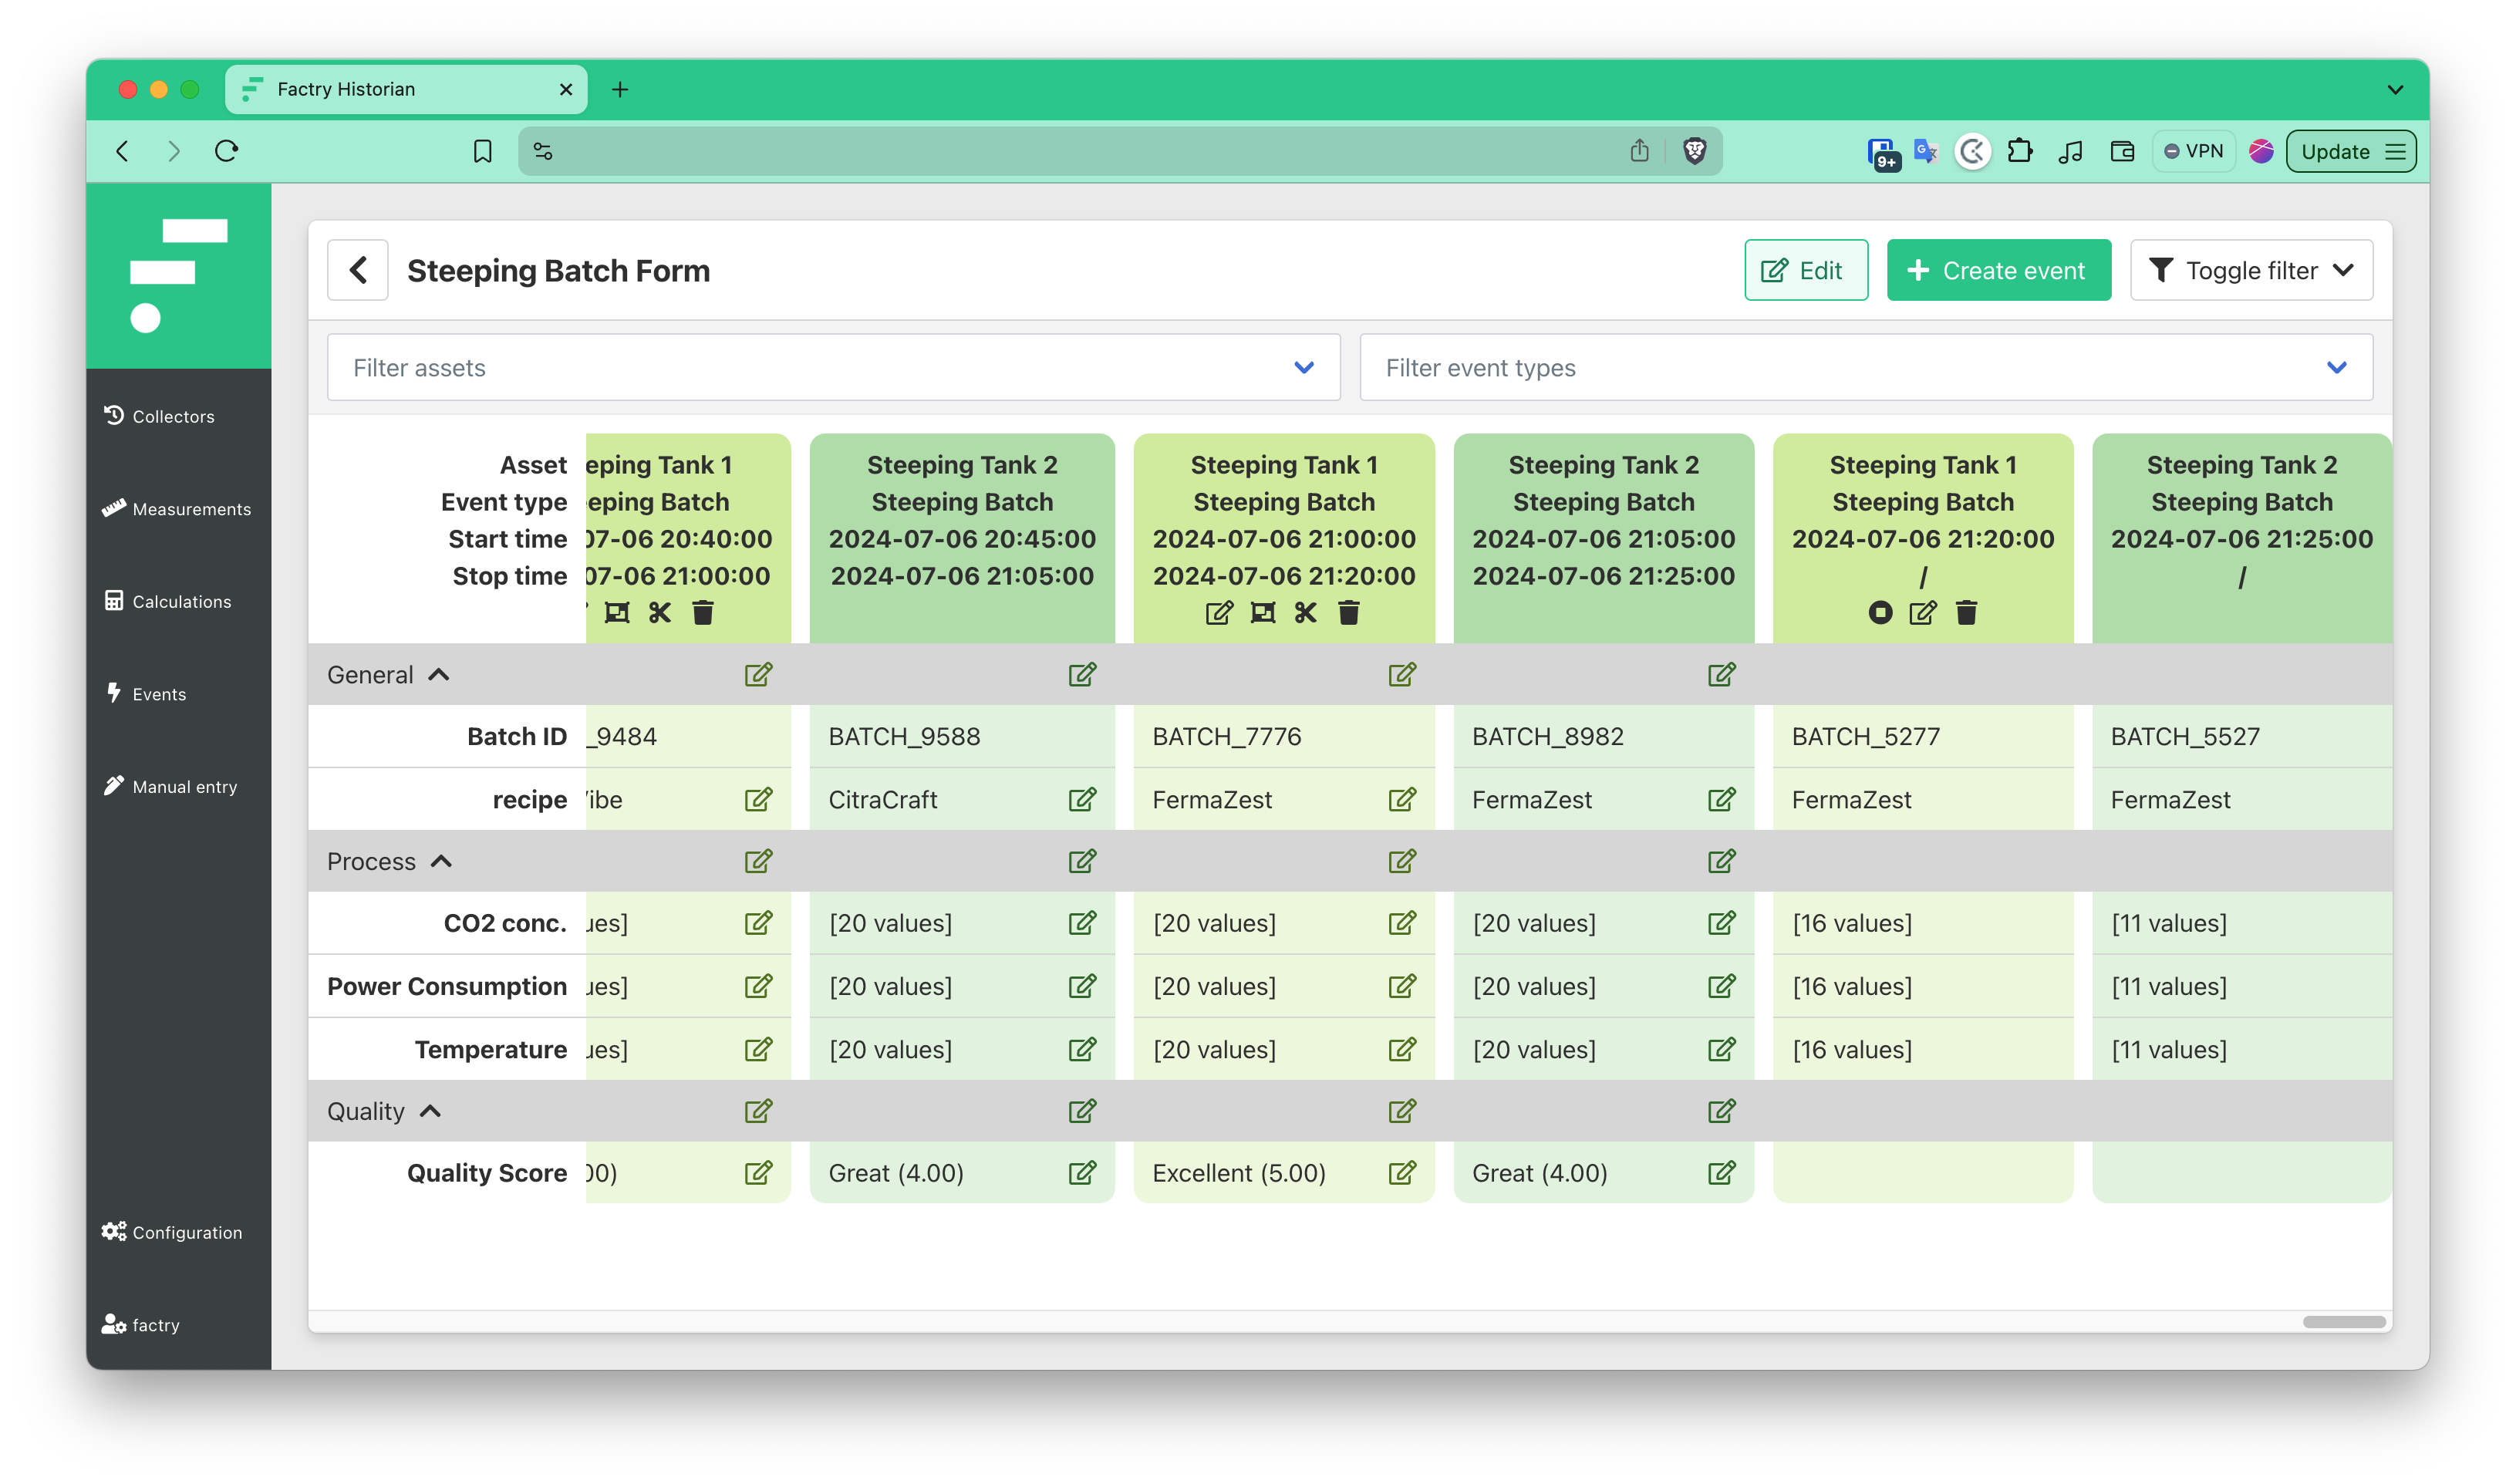
After adding the Quality Score to our steeping batches, we now have a complete dataset for demonstration in Grafana.
The results in Grafana
First, we’re going to set our Dashboard variables, as we’d like to build a dashboard that can be reused over different sites.
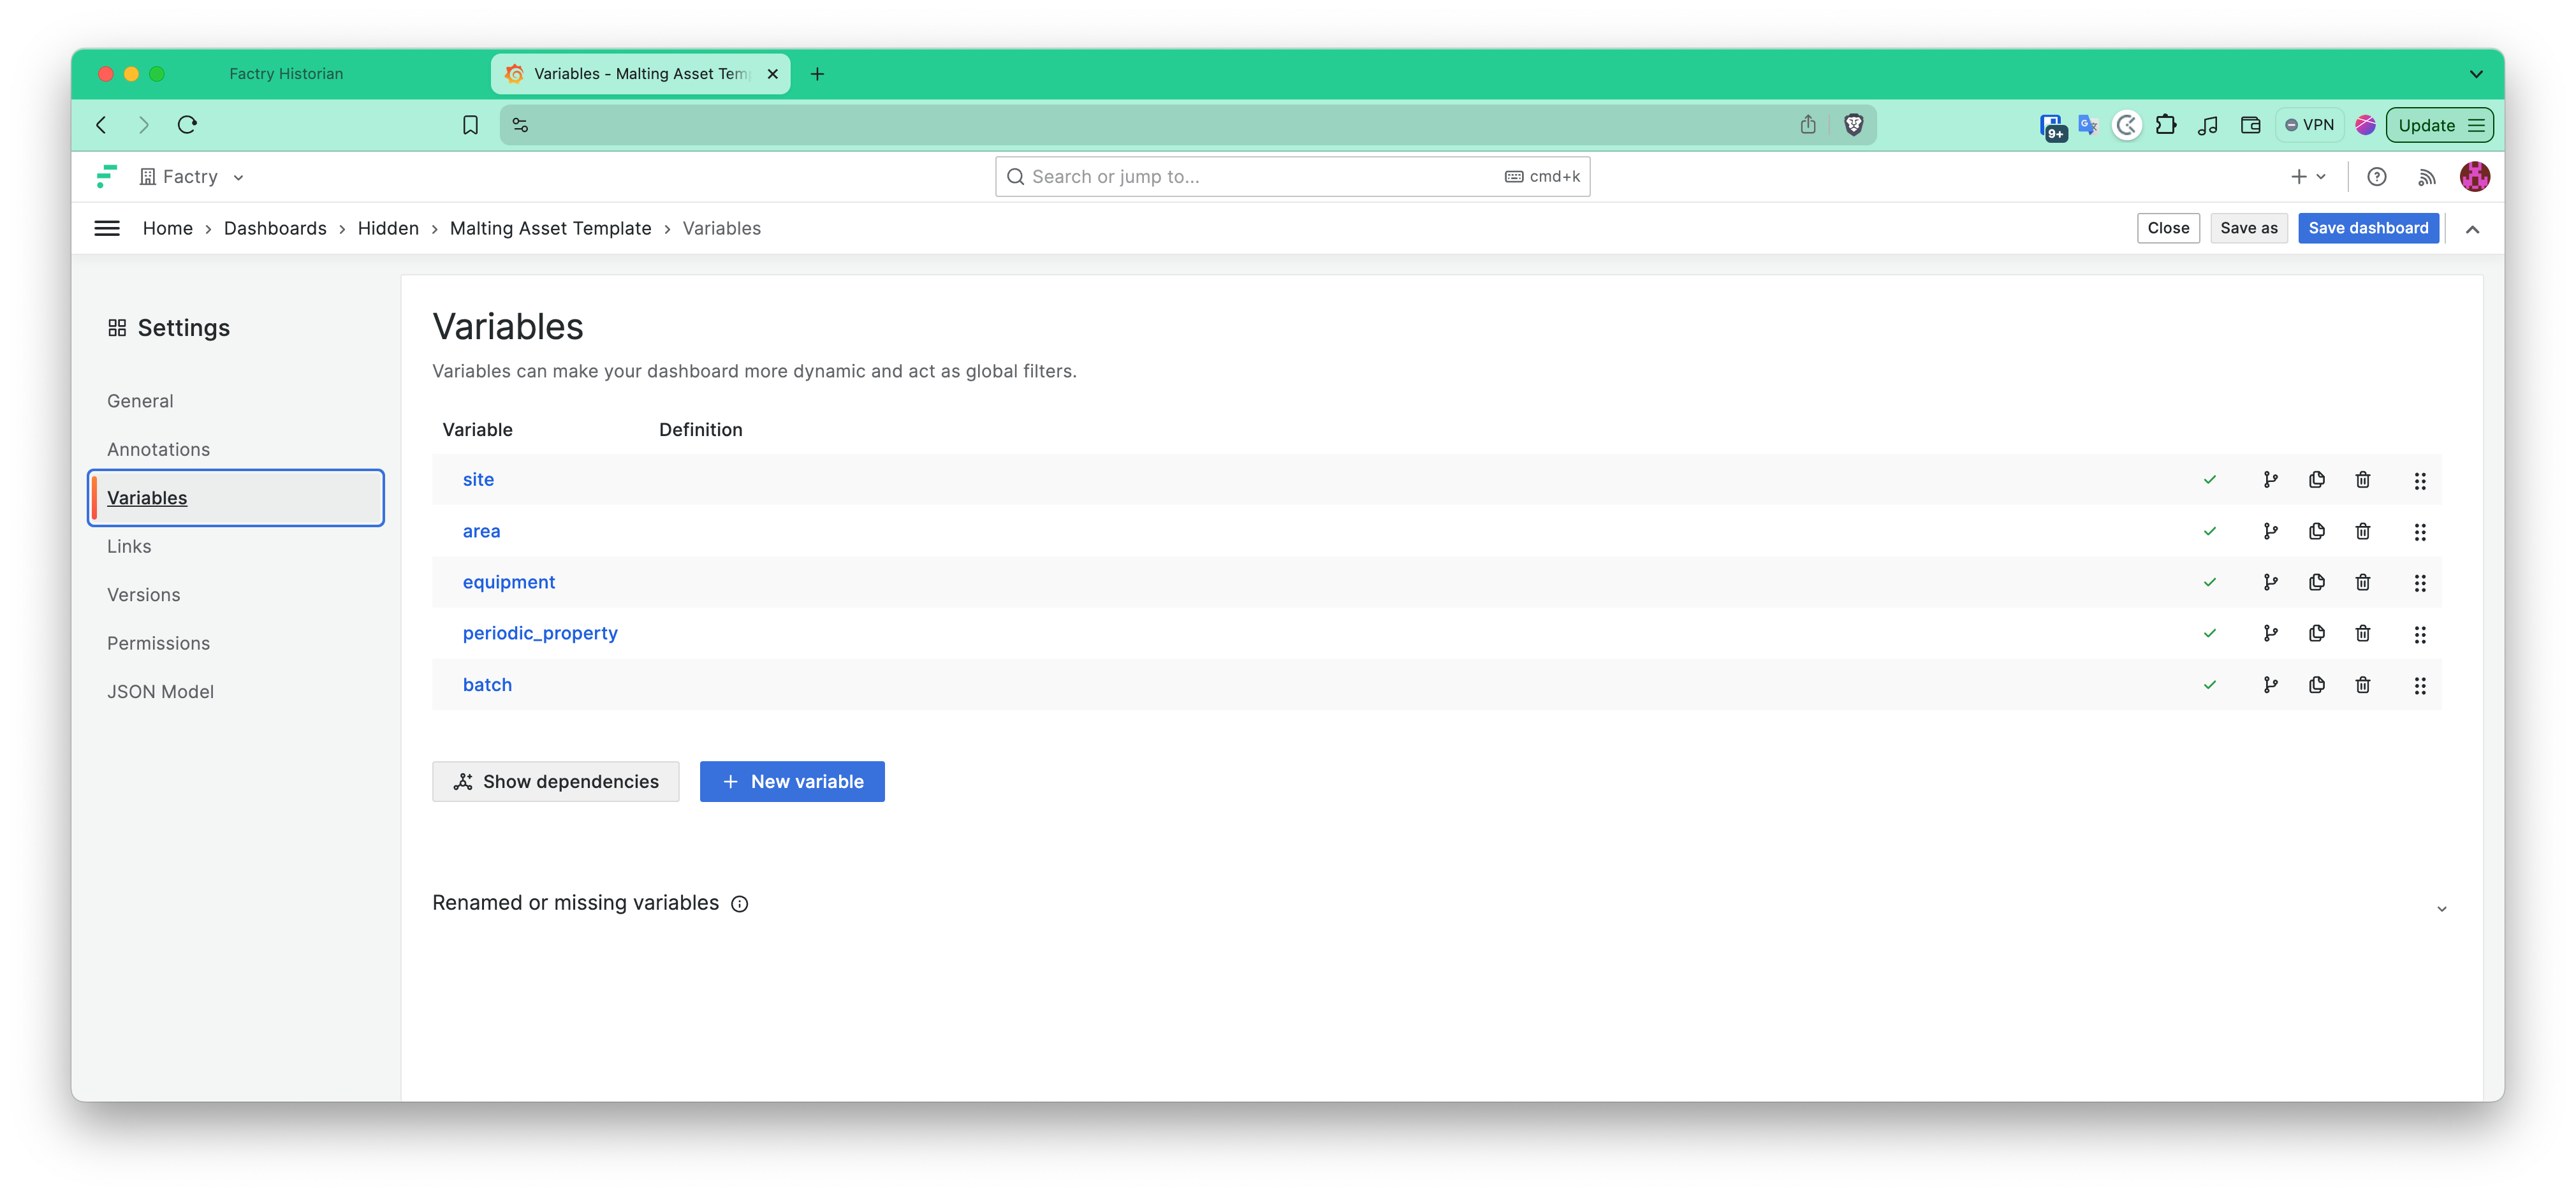
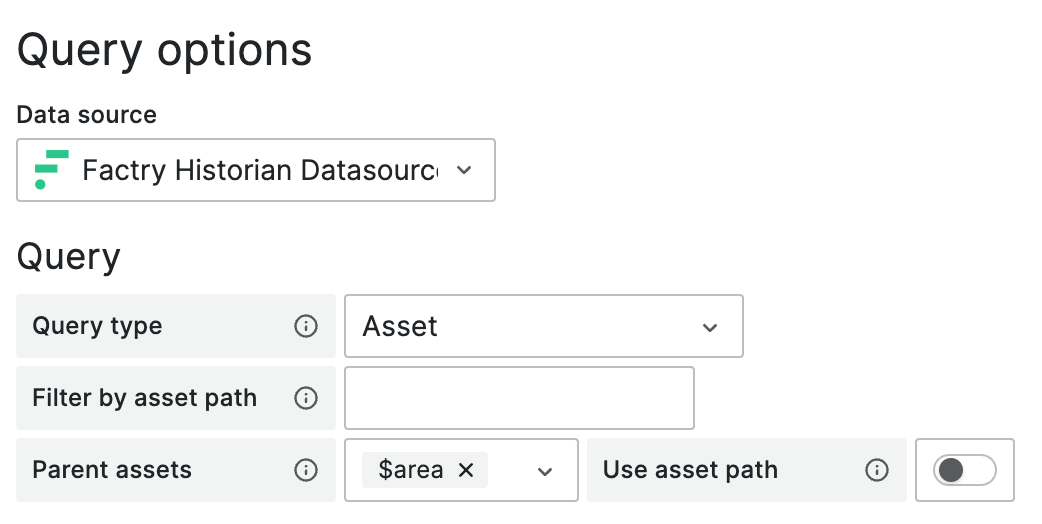
The Site, Area and Equipment variables are Asset type variables from Factry Historian. If a Site is selected, the Areas in that site will be refreshed. If an Area is selected, all Equipment in that Area will be refreshed. Finally, we’re creating 2 variables, one for selecting the periodic property and one for selecting a specific batch from the list of batches that ran on a specific equipment.
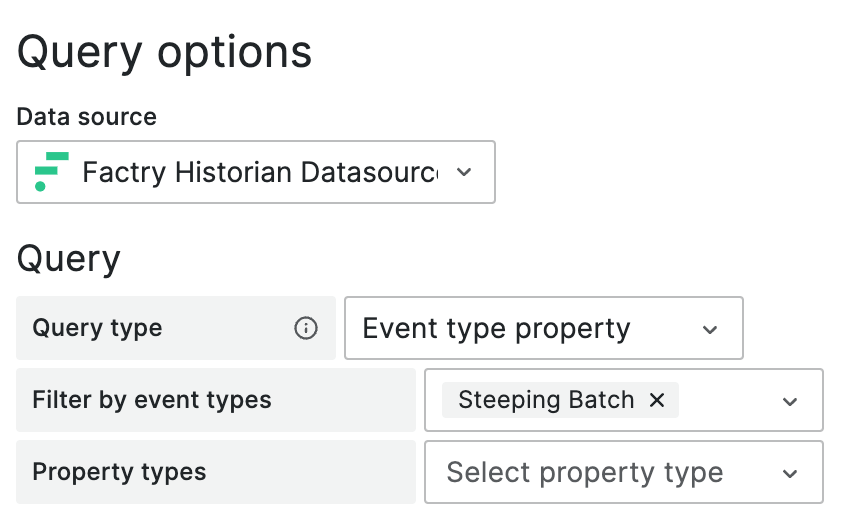
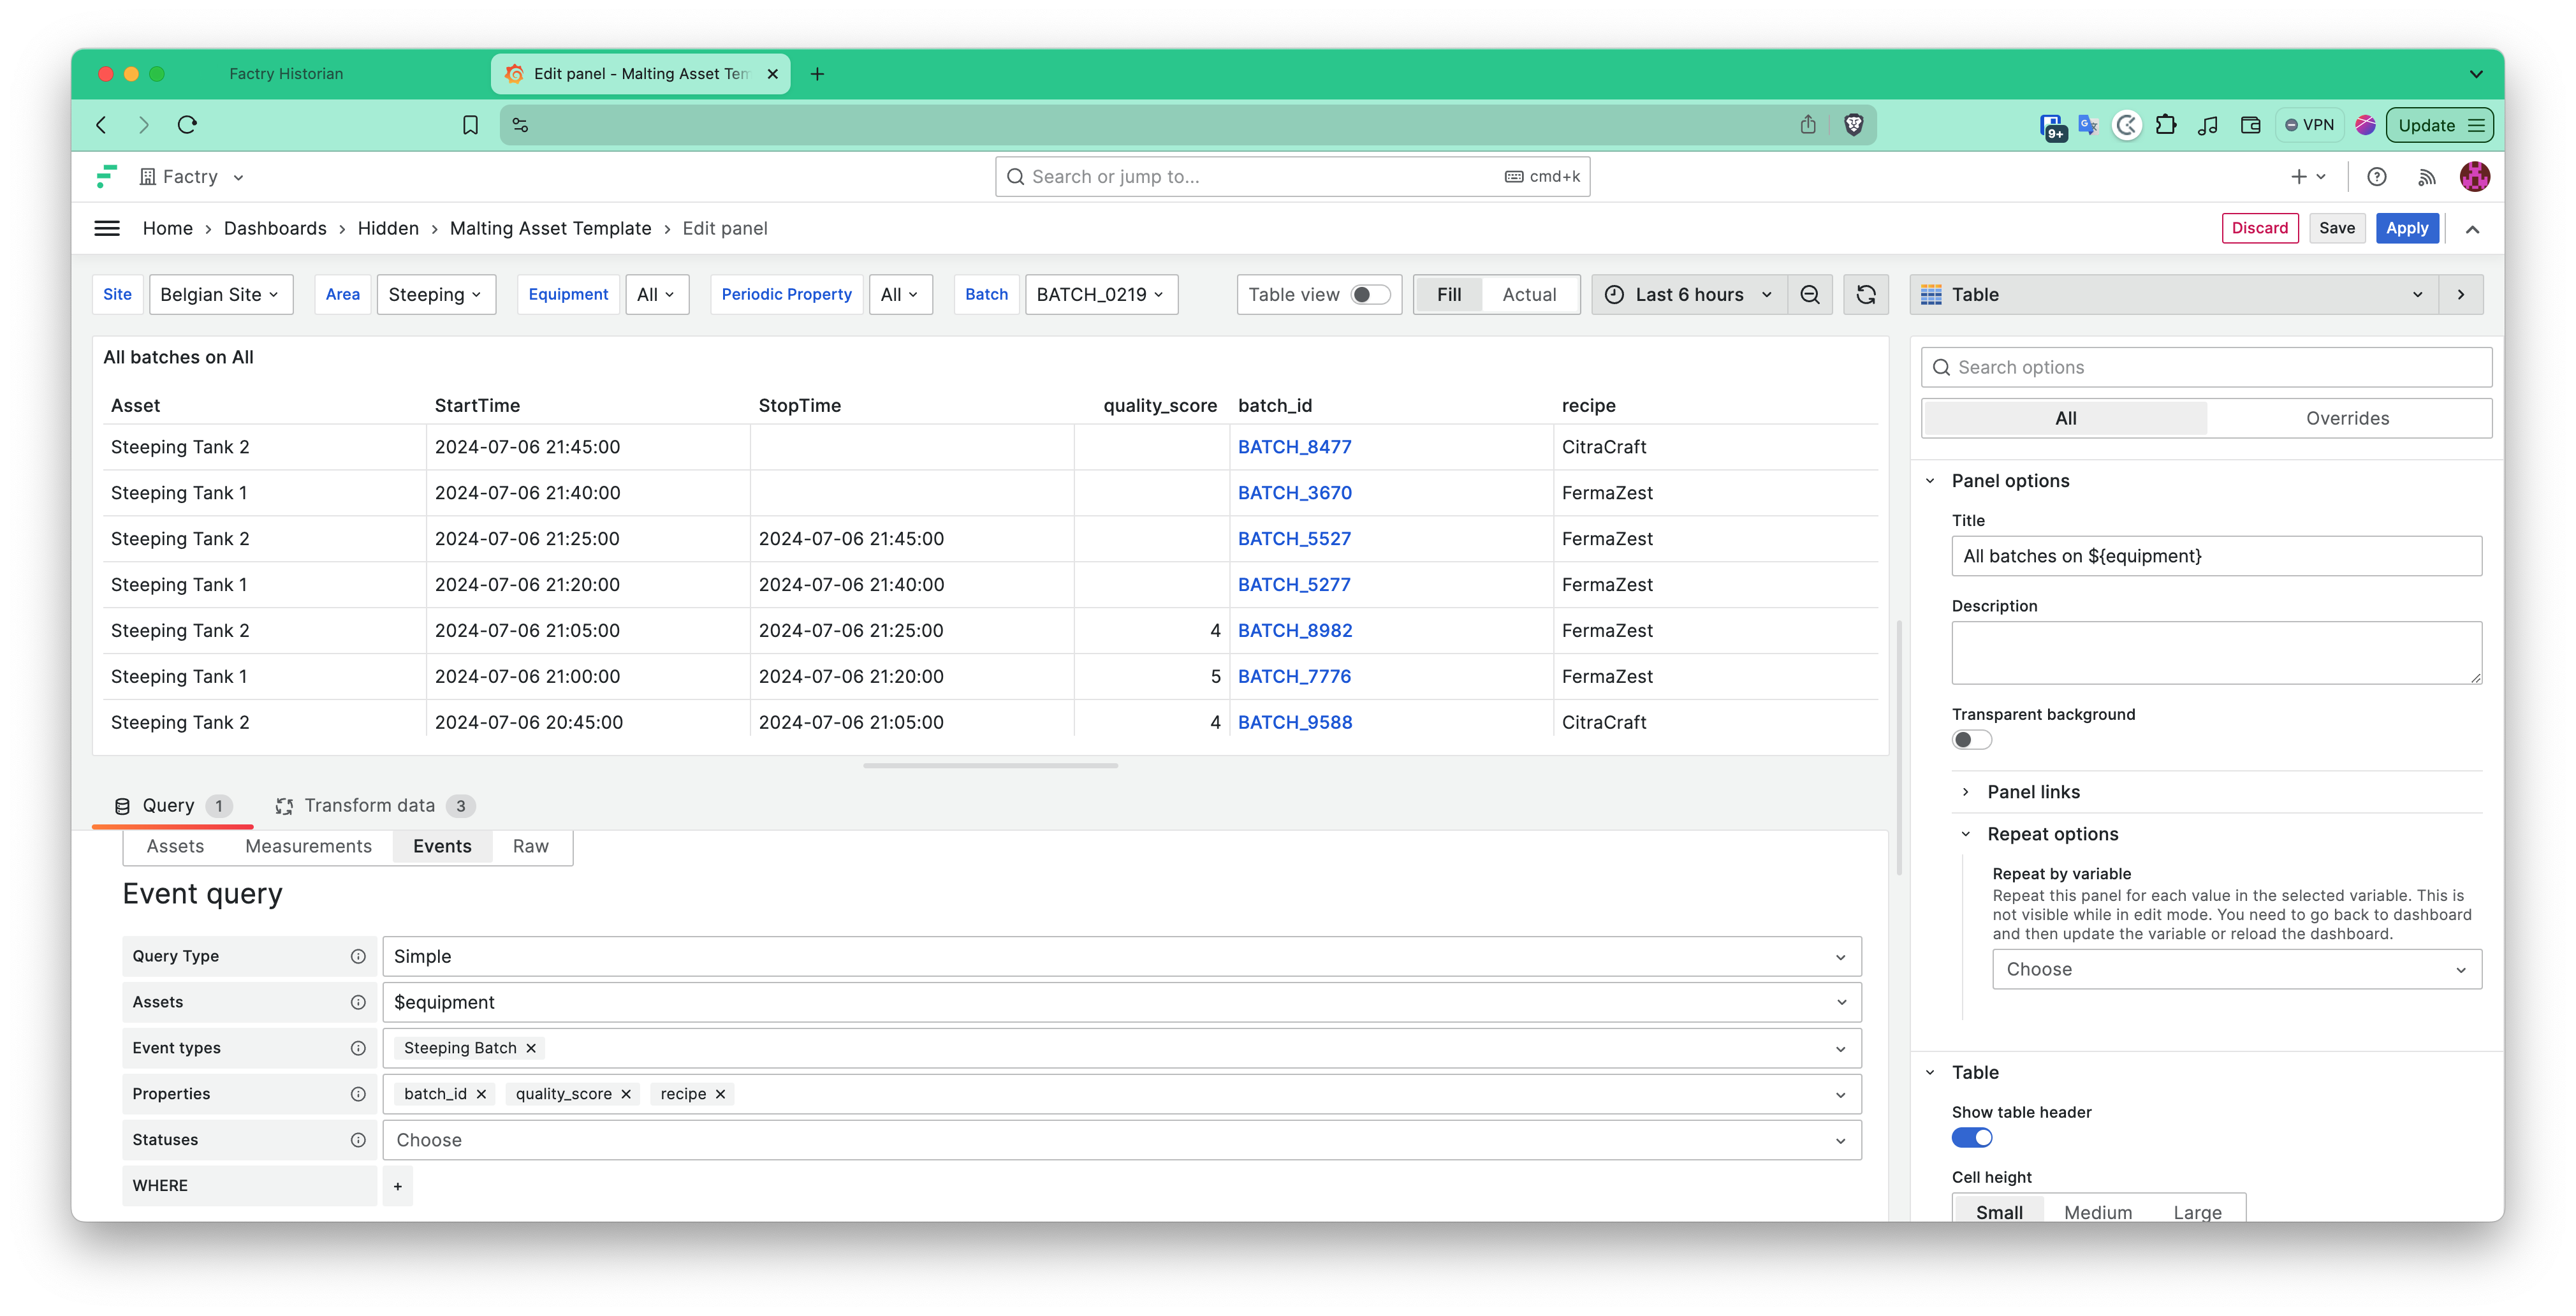
Finally, we create a table panel and select the “Events” tab from the Factry Historian data source. We want to display simple properties in the table, filter on the Equipment variable, display Steeping Batch events, and we want to display the batch ID, quality score and recipe in the table.
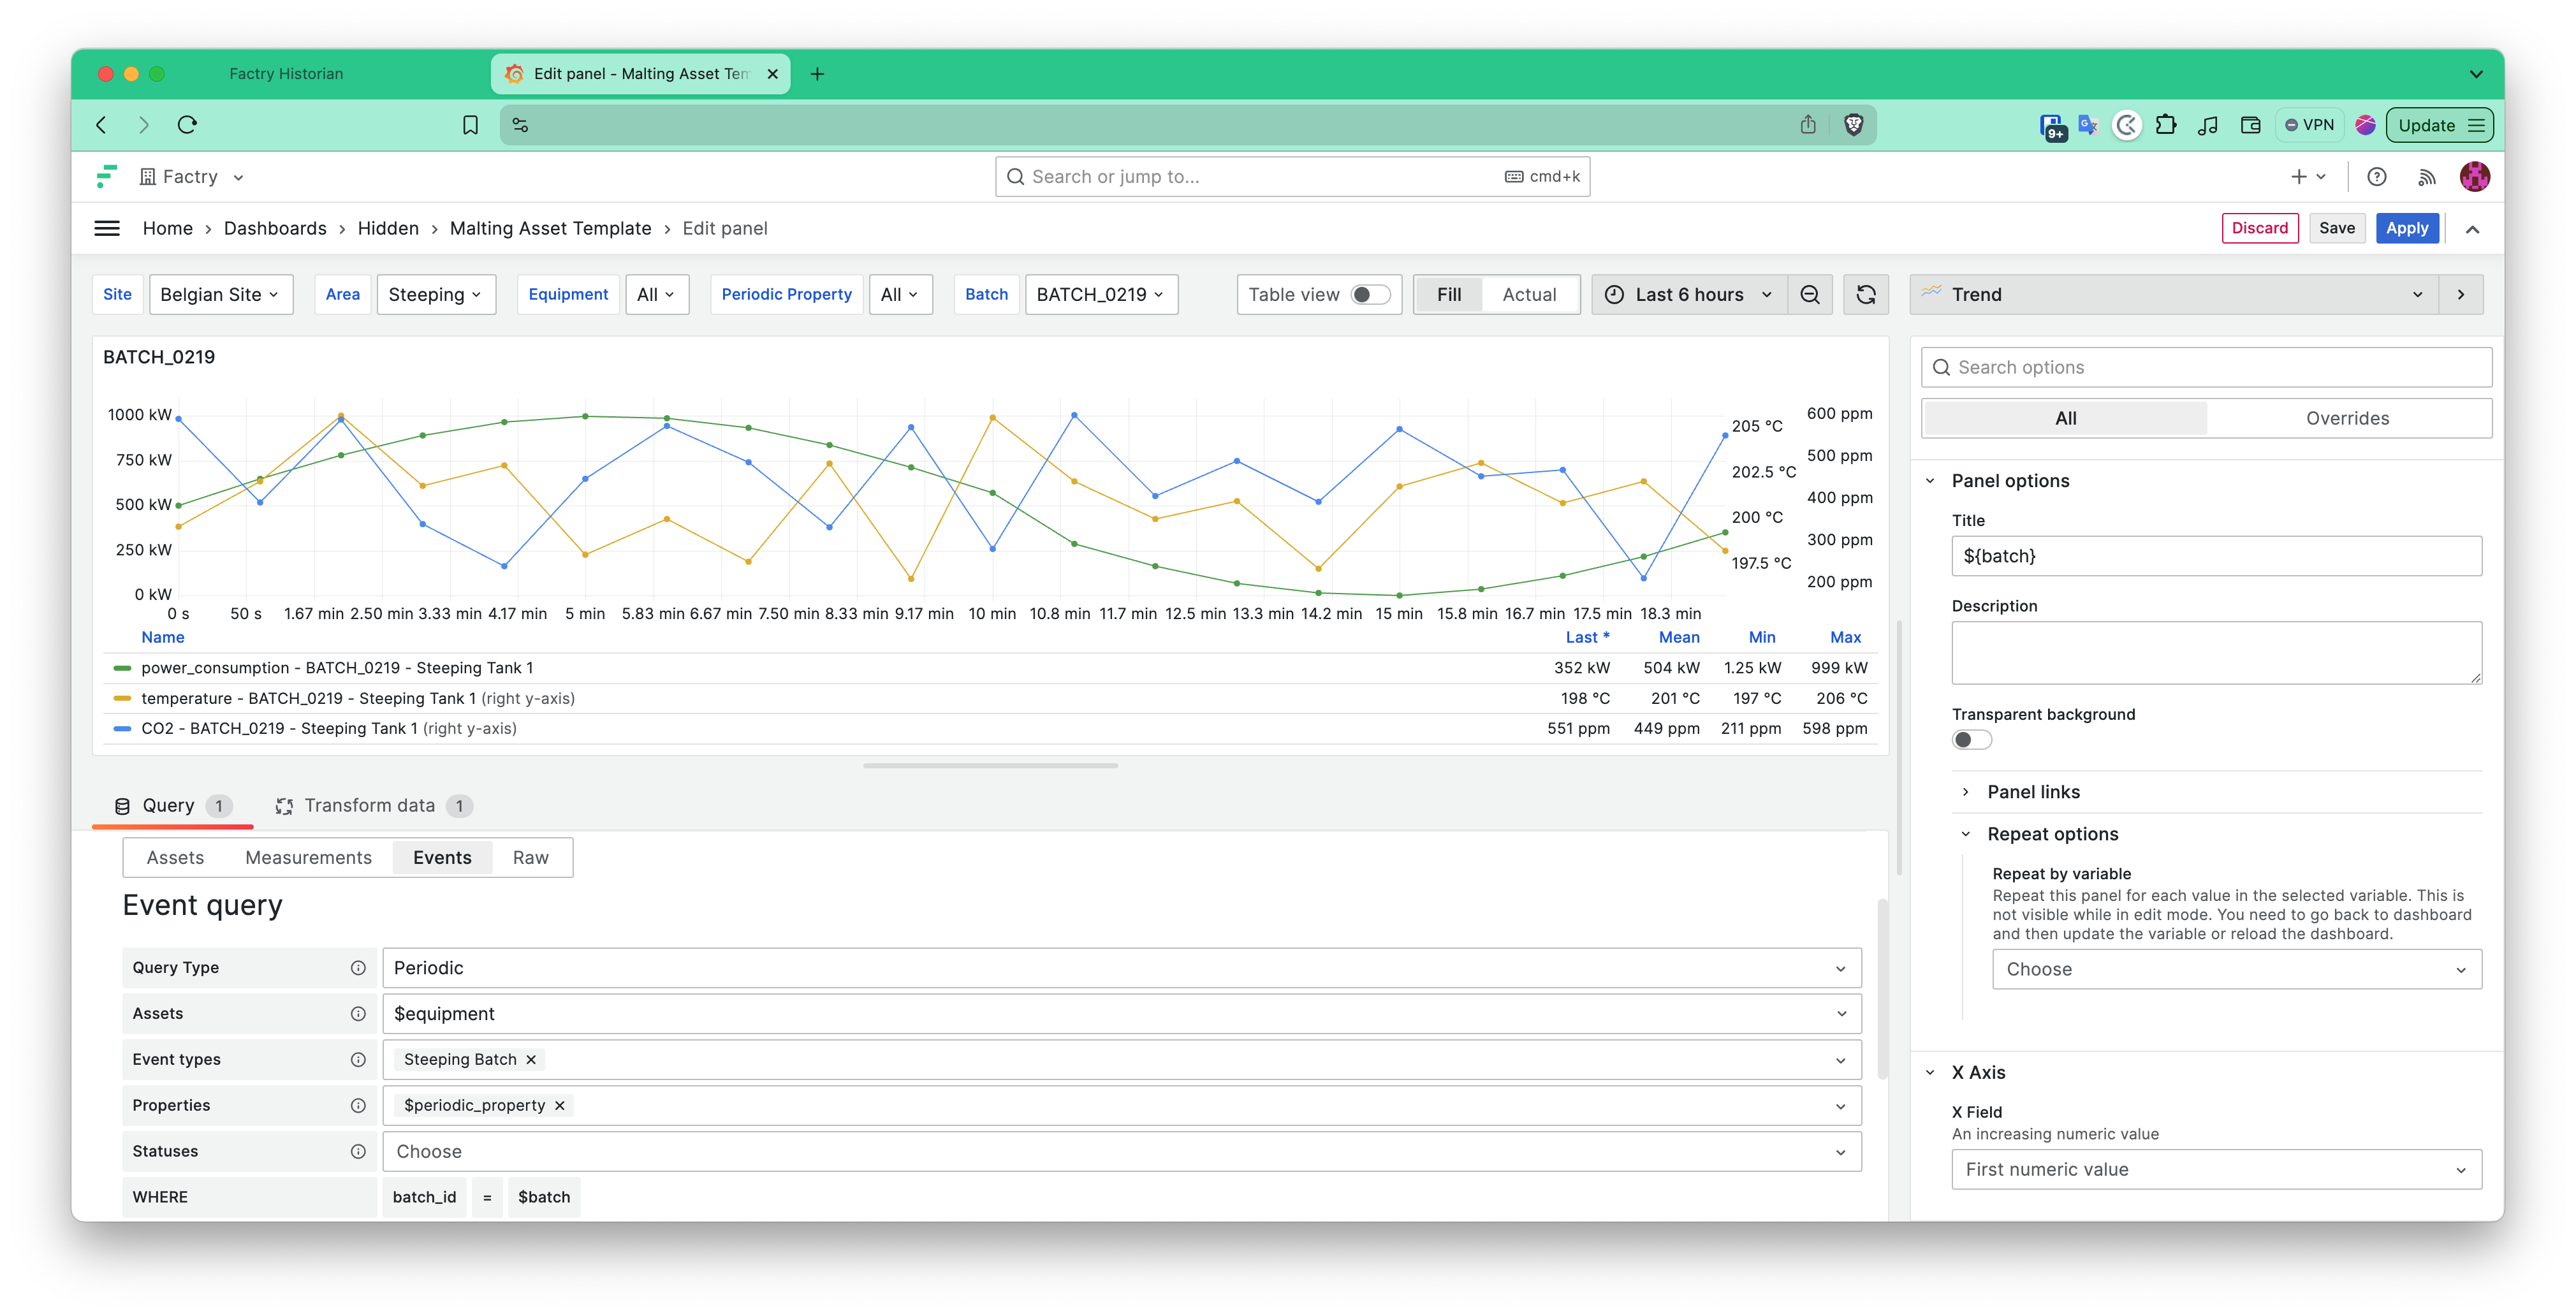
Secondly, we create a Trend panel to display the selected Periodic Properties of a Steeping Batch for the selected Equipment. Done!
Here’s how we visualize that information in Grafana.
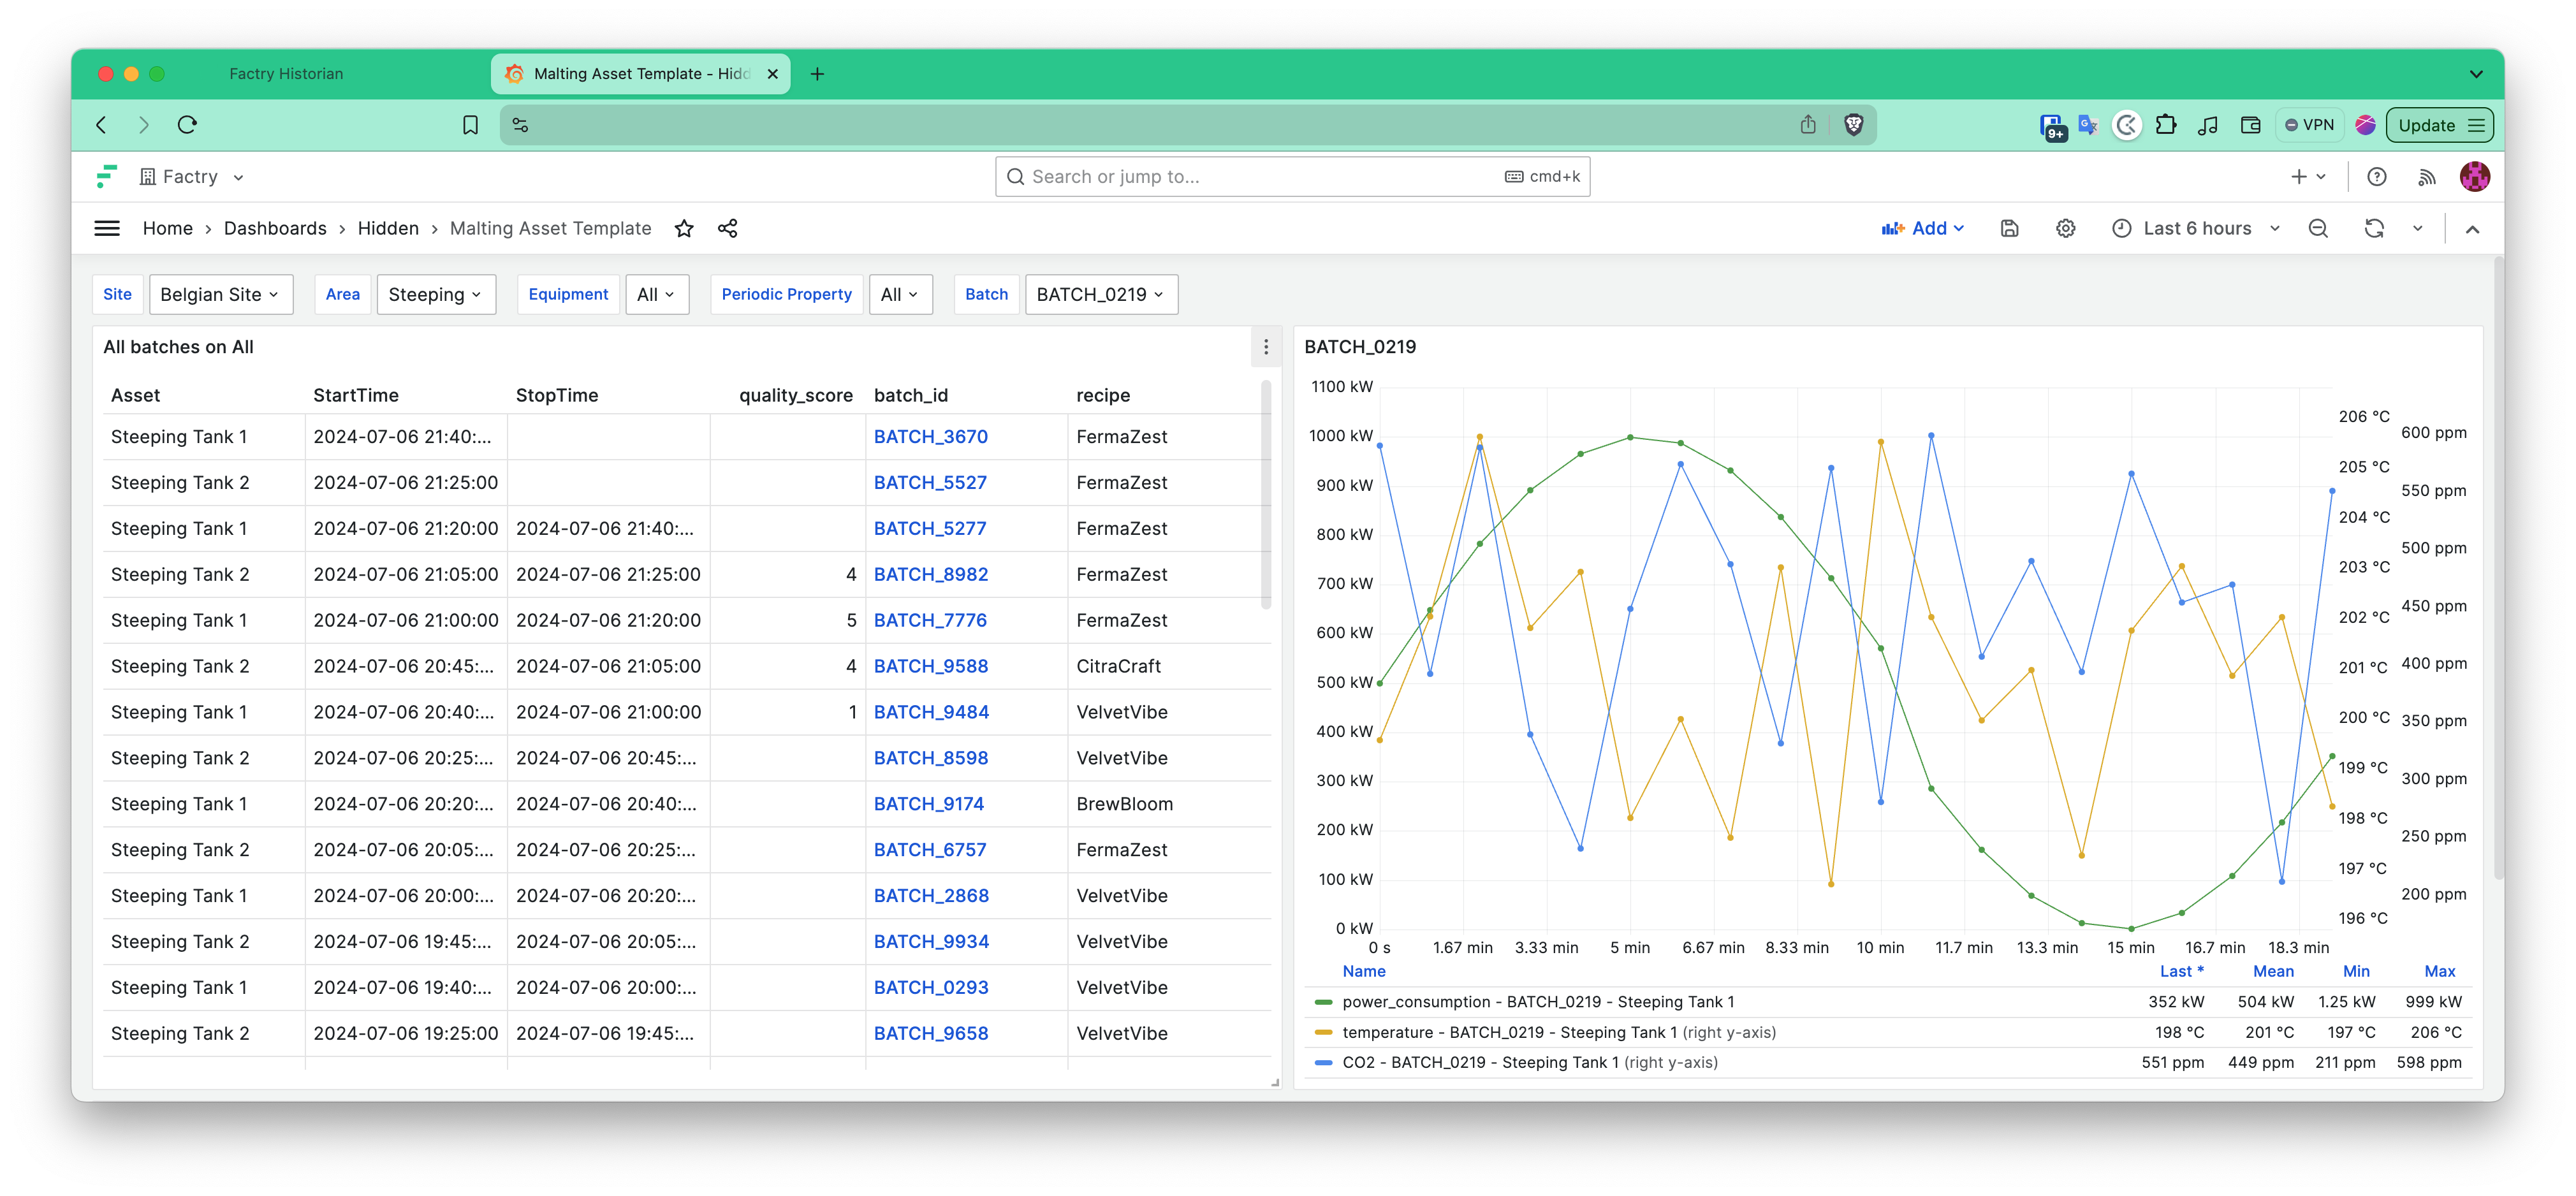
Using the variables on top of the dashboard, we can now quickly navigate through our asset structure, select a specific batch, and view its trends. All units of measurement are auto loaded (kW, °C, ppm), get their own y-axis and are autoscaled. Finally, we add a Data Link on the batch id in the table on the left, so we can drill-down and view the trends of that specific batch in more detail. Let’s click on Batch 7776.
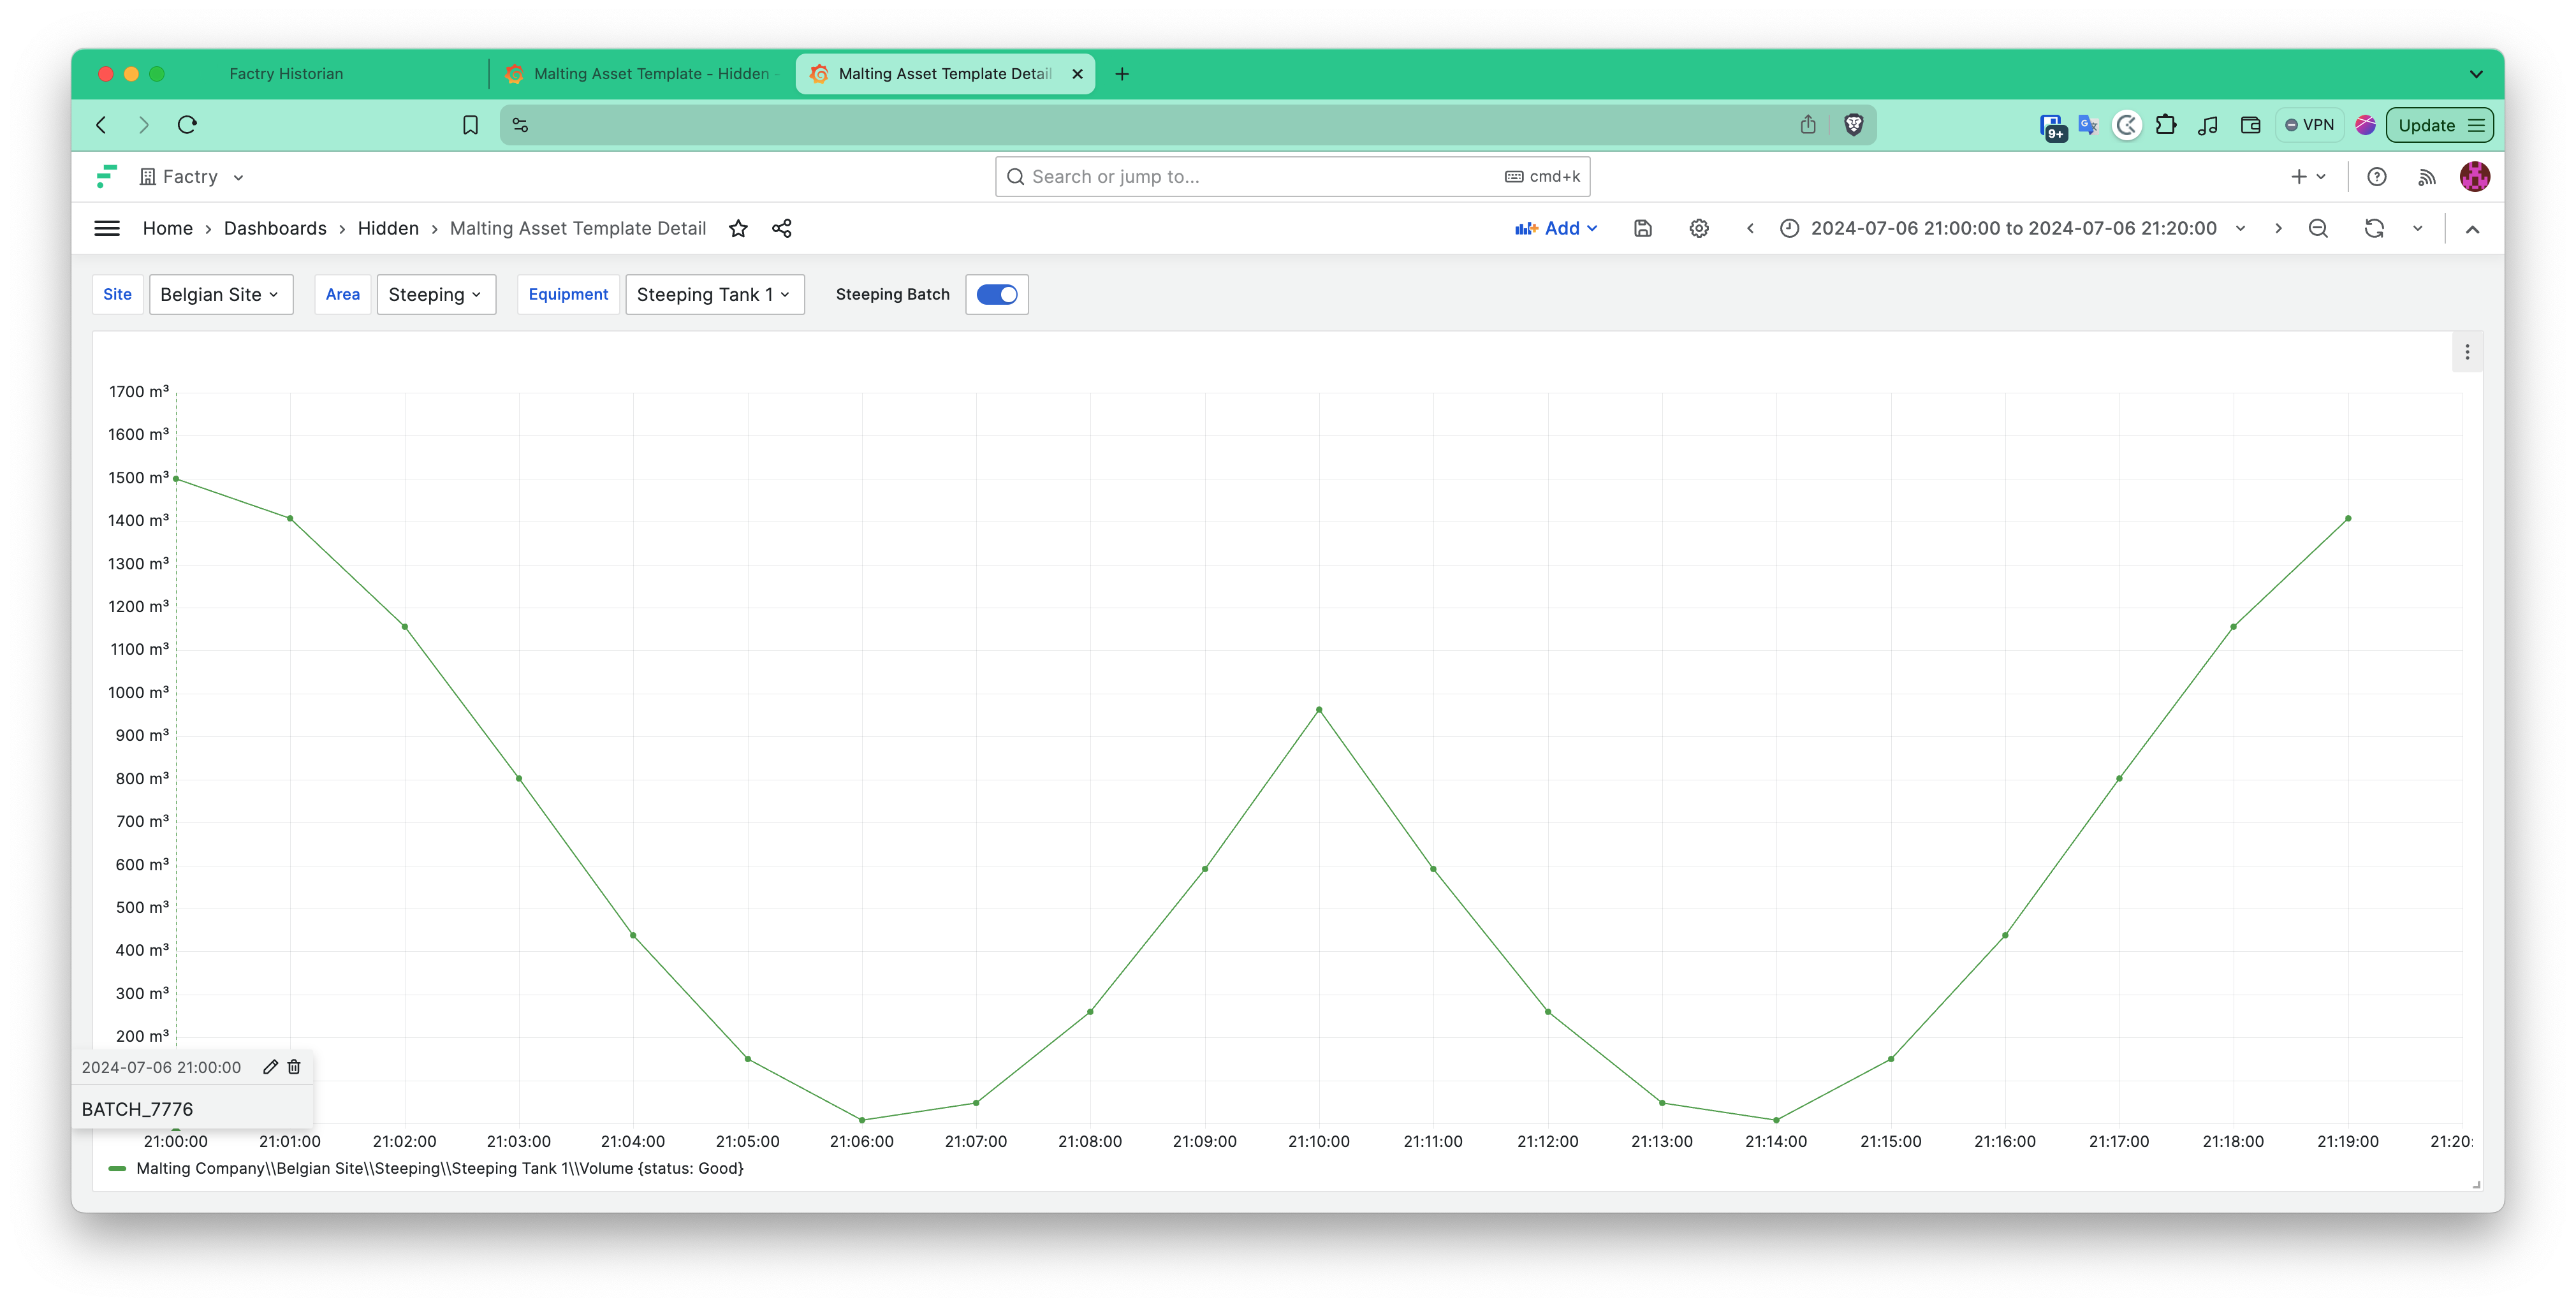
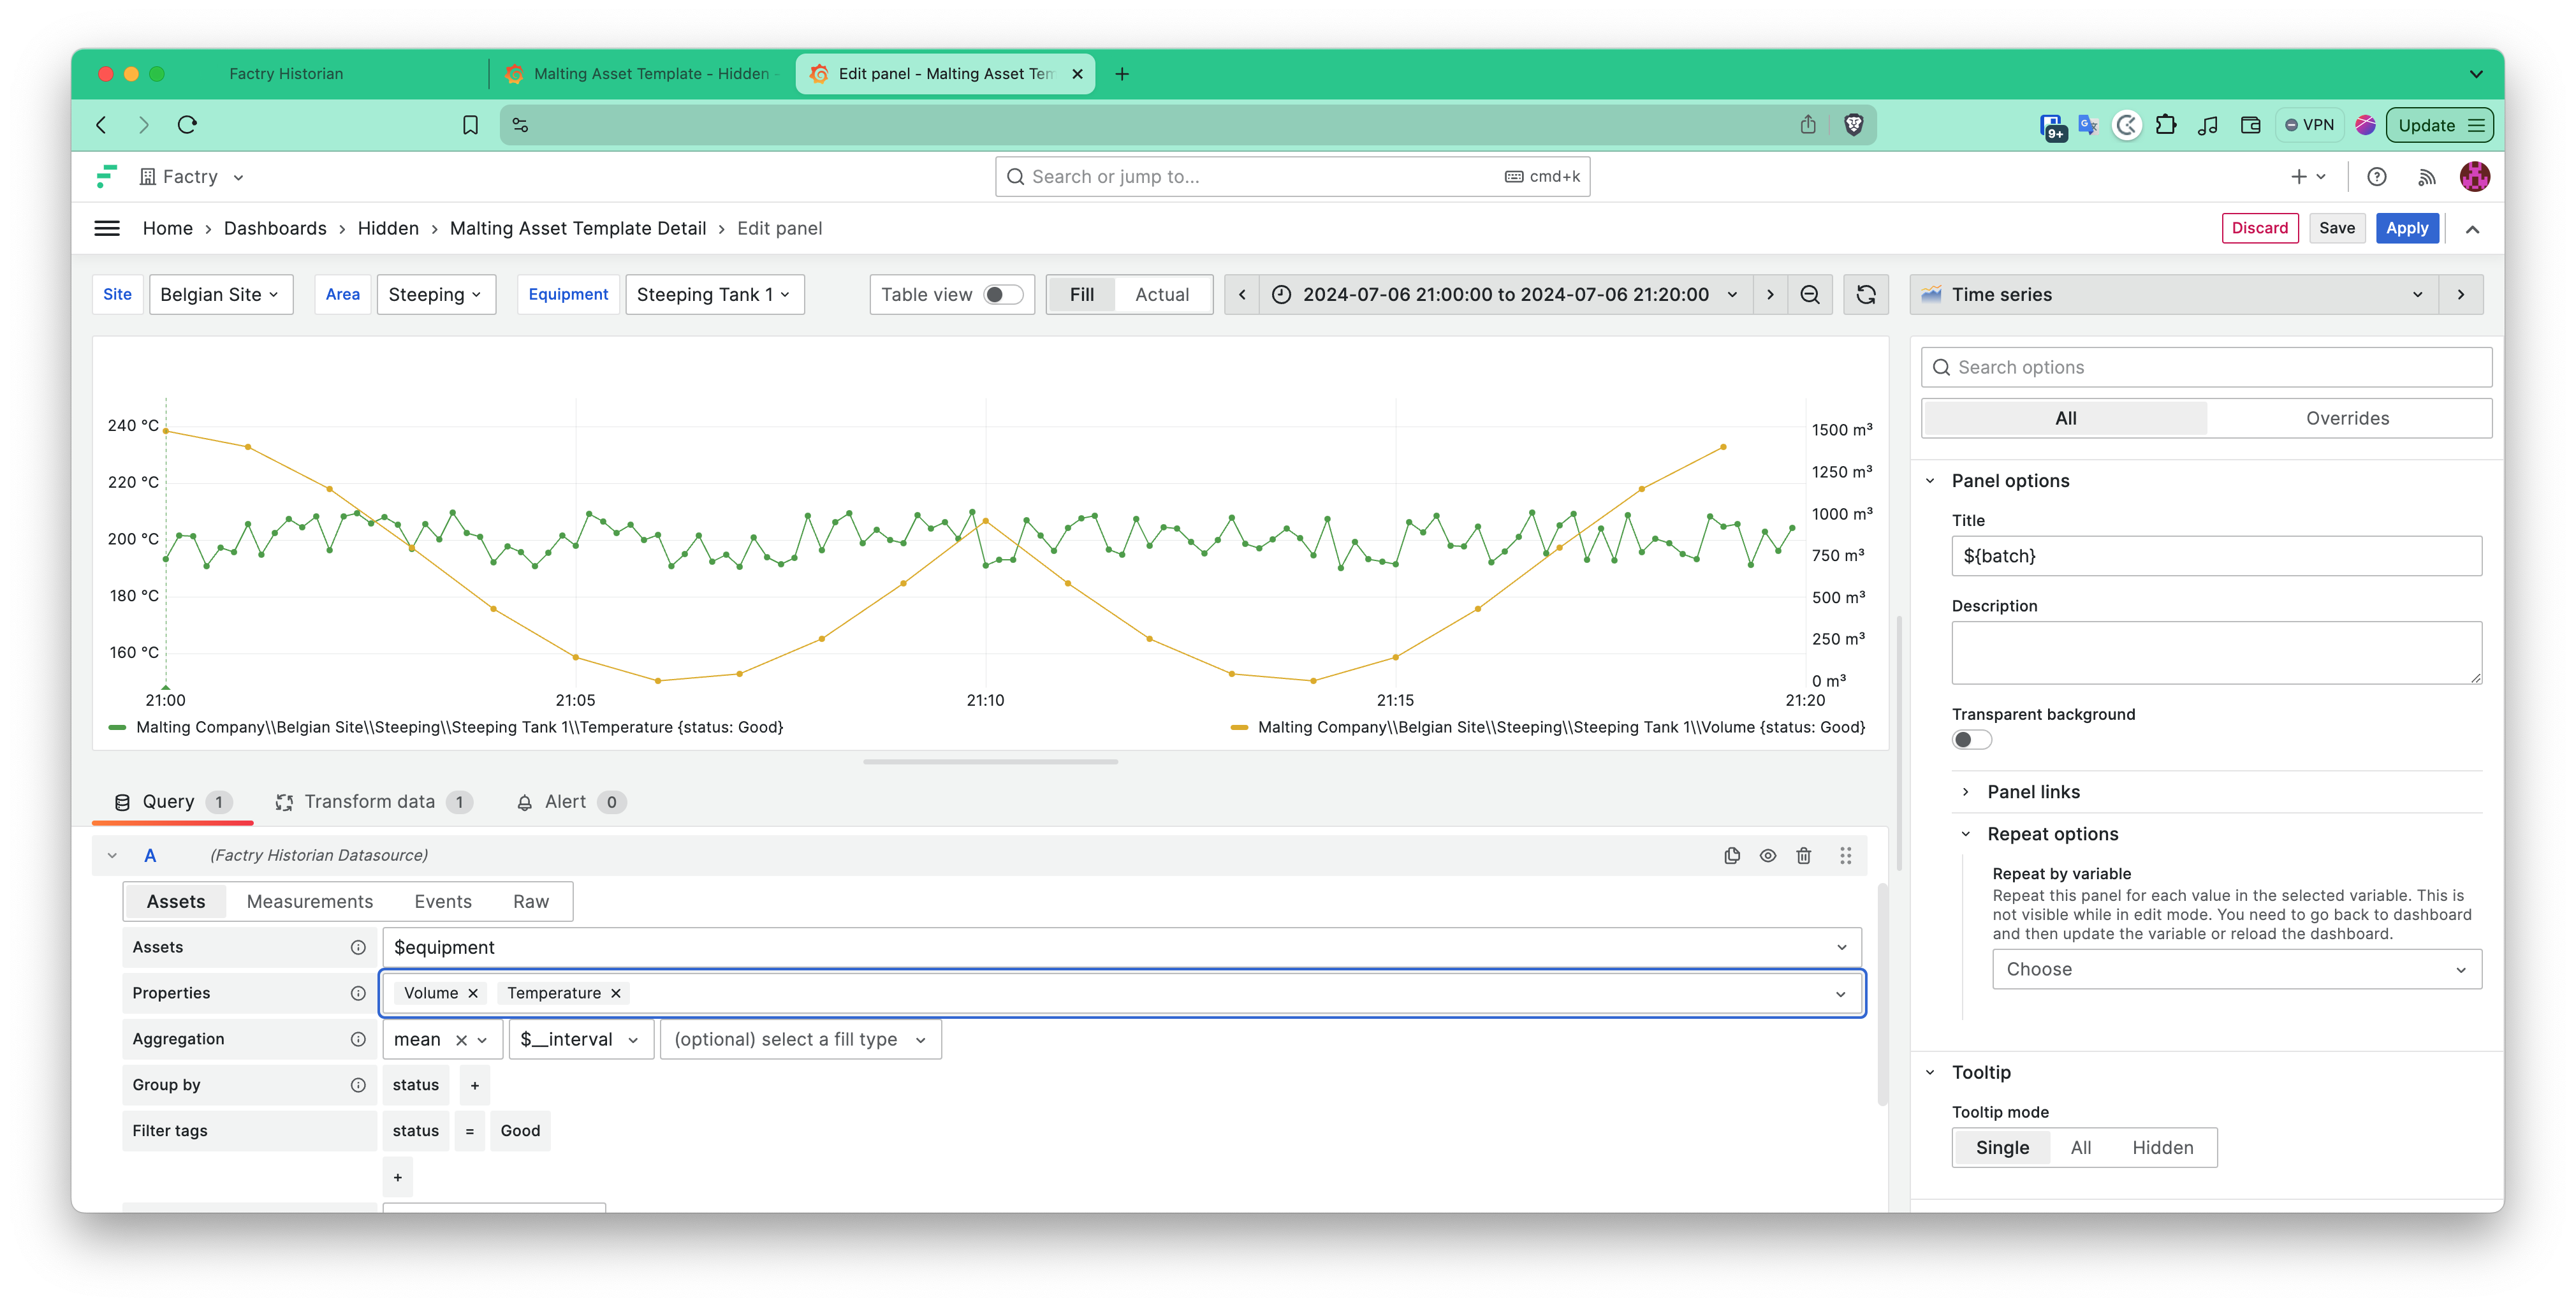
This opens up a trend dashboard with the exact start- and end time of the batch. We also add an annotation query (seen on the very left) that shows the start of the Batch. As a final addition, we’d like to ad-hoc trend the temperature of our batch over the volume periodic property. So, let’s do that. We edit the panel, add the additional property “Temperature” and voila:
Conclusion
In this blog post, we have demonstrated some of the capabilities of the Factry Historian data source plugin. Everything shown above has been done without writing a single query or line of code. With the Grafana Data Source Plugin, we put data in the hands of anyone who needs it, without the need for extensive training.
Our goal is simple: if you want to know something, you should be able to find it quickly and easily. We are excited to see how this plugin will transform the way you interact with your industrial data. Get it on grafana.com and start making the most of your data!
Discover the plugin during a free demo
Learn how Factry Historian can help you collect, store, and analyse process data.